项目地址: ruby-prof
在上一篇Ruby中的Profiling工具中,我们列举了几种 最常用的Profiler,不过只是简单介绍,这一次详细介绍一下ruby-prof的使用方法。
ruby-prof是比较强大的,支持cpu,内存使用,对象分配等等的性能分析,而且提供了很多友好的输出格式,不仅仅是
有基于文字,html的格式,还能输出graphviz格式的dot文件,以及适用与KCacheGrind的call tree格式,
其实这个格式是基于Valgrind的,这个工具很棒,大家可以去官网了解一下。
有两种方式运行ruby-prof,一种是需要在源码中插入ruby-prof的启动和停止代码:
require 'ruby-prof'

RubyProf.start
# 这里写入要进行性能剖析的代码
result = RubyProf.stop

# 选择一个Printer
printer = RubyProf::FlatPrinter.new(result)
printer.print(STDOUT)
还有一种是在命令行直接运行的,安装了Gem包ruby-prof之后,会同时安装ruby-prof命令,使用如下:
ruby-prof -p flat test.rb
这种方法更灵活,我们使用这种方法来说明ruby-prof的使用方法。
直接运行ruby-prof -h得到ruby-prof的帮助信息,由于太多,这里就不列出来了,大家可以自己在系统中执行看看。
其中-p参数为输出格式,以下就会逐一介绍各个Printer的格式,指数的意义以及相关显示工具的使用。在介绍输出格式的过程中,也会相应的介绍其他的几个参数的用途。
输出格式类型
flat                   - Prints a flat profile as text (default).
flat_with_line_numbers - same as flat, with line numbers.
graph                  - Prints a graph profile as text.
graph_html             - Prints a graph profile as html.
call_tree              - format for KCacheGrind
call_stack             - prints a HTML visualization of the call tree
dot                    - Prints a graph profile as a dot file
multi                  - Creates several reports in output directory
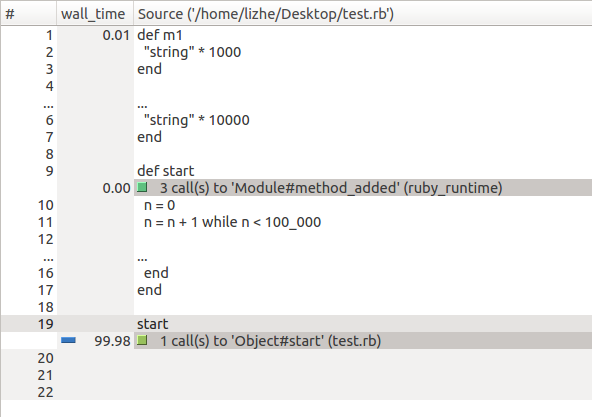
示例程序
def m1
  "string" * 1000
end

def m2
  "string" * 10000
end

def start
  n = 0
  n = n + 1 while n < 100_000

  10000.times do
    m1
    m2
  end
end

start
这是最基础的测试程序,我们会在介绍ruby-prof的功能的同时添加其他代码来进行演示。
GC对性能剖析的影响
进行性能剖析的时候GC的运行总会对结果产生比较大的影响,这里我们暂时不考虑它,我们会有另外一篇文章 做专门的介绍。
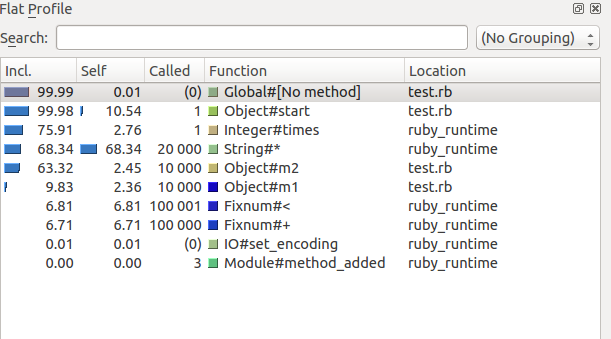
最简单的输出格式 - flat
ruby-prof -p flat test.rb
Measure Mode: wall_time
Thread ID: 12161840
Fiber ID: 19223800
Total: 0.206998
Sort by: self_time

 %self      total      self      wait     child     calls  name
 68.50      0.142     0.142     0.000     0.000    20000   String#*
 10.45      0.207     0.022     0.000     0.185        1   Object#start
  6.82      0.014     0.014     0.000     0.000   100001   Fixnum#<
  6.46      0.013     0.013     0.000     0.000   100000   Fixnum#+
  2.84      0.158     0.006     0.000     0.152        1   Integer#times
  2.52      0.128     0.005     0.000     0.123    10000   Object#m2
  2.40      0.024     0.005     0.000     0.019    10000   Object#m1
  0.01      0.207     0.000     0.000     0.207        2   Global#[No method]
  0.01      0.000     0.000     0.000     0.000        2   IO#set_encoding
  0.00      0.000     0.000     0.000     0.000        3   Module#method_added

* indicates recursively called methods
先来一一解释一下各项指标的意思:
| Indicator | Explanation |
|---|---|
| %self | 方法本身执行的时间占比,不包括调用的其他的方法执行时间 |
| total | 方法执行的总时间,包括调用的其他方法的执行时间 |
| self | 方法本身执行的时间,不包括调用的其他的方法执行时间 |
| wait | 多线程中,等待其他线程的时间,在单线程程序中,始终为0 |
| child | 方法调用的其他方法的总时间 |
| calls | 方法的调用次数 |
他们之间的基本关系就是:
total = self + wait + child
具体来说就是String#*这个方法占据程序运行时间的68.50%,花费了0.142秒,执行了20000次,而
Object#start方法就是代码中定义的start方法,它占据程序运行时间的10.45%,花费了0.022秒,调用的
方法花费了0.185秒,调用了1次,总共花费的时间(total)为0.022 + 0.185 = 0.207,相信现在大家都能明
白这些指数的意义了。
现在我们明白了这个输出的指标意思,假如这个程序是存在性能问题的,那么这些数据说明了什么问题?通常情况下,
我们需要看两个指标,%self和calls,单纯看%self有时候是没有用的,上面这个例子,它的耗时方法是String#*,
我们不太可能去改进语言本身的方法,这种情况下,我们发现calls的值比较大,那么就想办法减少对String#*的方法调用。
利用flat输出格式,也就只能发现这样简单的问题,如果这时候想要减少String#*的方法调用,就需要知道是谁调用了它,
而这个输出格式是体现不出来的,就需要选择其他的输出格式。
简单的调用关系输出 - graph
ruby-prof -p graph test.rb
Measure Mode: wall_time
Thread ID: 17371960
Fiber ID: 24397420
Total Time: 0.21026015281677246
Sort by: total_time

  %total   %self      total       self       wait      child            calls    Name
--------------------------------------------------------------------------------
  99.99%   0.01%      0.210      0.000      0.000      0.210                2      Global#[No method]
                      0.210      0.022      0.000      0.188              1/1      Object#start
                      0.000      0.000      0.000      0.000              3/3      Module#method_added
--------------------------------------------------------------------------------
                      0.210      0.022      0.000      0.188              1/1      Global#[No method]
  99.98%  10.34%      0.210      0.022      0.000      0.188                1      Object#start
                      0.161      0.006      0.000      0.155              1/1      Integer#times
                      0.014      0.014      0.000      0.000    100001/100001      Fixnum#<
                      0.014      0.014      0.000      0.000    100000/100000      Fixnum#+
--------------------------------------------------------------------------------
                      0.161      0.006      0.000      0.155              1/1      Object#start
  76.48%   2.68%      0.161      0.006      0.000      0.155                1      Integer#times
                      0.130      0.005      0.000      0.125      10000/10000      Object#m2
                      0.025      0.005      0.000      0.020      10000/10000      Object#m1
--------------------------------------------------------------------------------
                      0.020      0.020      0.000      0.000      10000/20000      Object#m1
                      0.125      0.125      0.000      0.000      10000/20000      Object#m2
  69.23%  69.23%      0.146      0.146      0.000      0.000            20000      String#*
--------------------------------------------------------------------------------
                      0.130      0.005      0.000      0.125      10000/10000      Integer#times
  61.81%   2.28%      0.130      0.005      0.000      0.125            10000      Object#m2
                      0.125      0.125      0.000      0.000      10000/20000      String#*
--------------------------------------------------------------------------------
                      0.025      0.005      0.000      0.020      10000/10000      Integer#times
  11.99%   2.28%      0.025      0.005      0.000      0.020            10000      Object#m1
                      0.020      0.020      0.000      0.000      10000/20000      String#*
--------------------------------------------------------------------------------
                      0.014      0.014      0.000      0.000    100001/100001      Object#start
   6.73%   6.73%      0.014      0.014      0.000      0.000           100001      Fixnum#<
--------------------------------------------------------------------------------
                      0.014      0.014      0.000      0.000    100000/100000      Object#start
   6.42%   6.42%      0.014      0.014      0.000      0.000           100000      Fixnum#+
--------------------------------------------------------------------------------
   0.01%   0.01%      0.000      0.000      0.000      0.000                2      IO#set_encoding
--------------------------------------------------------------------------------
                      0.000      0.000      0.000      0.000              3/3      Global#[No method]
   0.00%   0.00%      0.000      0.000      0.000      0.000                3      Module#method_added

* indicates recursively called methods
这次输出的内容就比较丰富,不过也可能让人头有点晕。我们来慢慢分析一下。
首先这次排序方式不一样了,是按照total_time排序的,flat输出格式是按照self_time排序的。整个报告被虚线分割为
几部分,每部分中都描述了不定个数的方法调用信息,但是注意最左边两列,就是%total, %self那两列不为空的那一行,
先来看第二部分:
--------------------------------------------------------------------------------
                      0.210      0.022      0.000      0.188              1/1      Global#[No method]
  99.98%  10.34%      0.210      0.022      0.000      0.188                1      Object#start
                      0.161      0.006      0.000      0.155              1/1      Integer#times
                      0.014      0.014      0.000      0.000    100001/100001      Fixnum#<
                      0.014      0.014      0.000      0.000    100000/100000      Fixnum#+
--------------------------------------------------------------------------------
Object#start方法的执行花费了99.98%的总时间,不包括子方法调用的话,花费了10.34%的时间,调用了
一次,并且在start方法中还调用了Integer#times、Fixnum#<和Fixnum#+三个方法。
再来看右数第二列(calls),是被/分隔的两个数,左边的数是此方法在这一层级调用了多少次Object#start,右边的数是
Object#start这个程序运行过程中总的运行次数。而Object#start调用的三个方法calls列出的是在Object#start
中执行的次数,以及总的执行次数。
最开始的一部分中有这样两个方法:Global#[No method]代表没有caller,可以理解为ruby正在准备执行环境,
Module#method_added是当有实例方法添加的时候,这个方法都会被触发。
那么这种输出格式能解释什么问题呢?在flat输出格式中我们已经定位到了问题是String#*的调用次数太多,
那么根据这个graph格式的输出格式我们应该可以找到是谁导致的这个问题。
先把可以发现问题的部分截出来:
--------------------------------------------------------------------------------
                      0.020      0.020      0.000      0.000      10000/20000      Object#m1
                      0.125      0.125      0.000      0.000      10000/20000      Object#m2
  69.23%  69.23%      0.146      0.146      0.000      0.000            20000      String#*
--------------------------------------------------------------------------------
                      0.130      0.005      0.000      0.125      10000/10000      Integer#times
  61.81%   2.28%      0.130      0.005      0.000      0.125            10000      Object#m2
                      0.125      0.125      0.000      0.000      10000/20000      String#*
--------------------------------------------------------------------------------
                      0.025      0.005      0.000      0.020      10000/10000      Integer#times
  11.99%   2.28%      0.025      0.005      0.000      0.020            10000      Object#m1
                      0.020      0.020      0.000      0.000      10000/20000      String#*
--------------------------------------------------------------------------------
第一部分说明String#*在Object#m1和Object#m1中各被调用了10000次,一共执行了20000次,次数一样,接着看下面,
同样是10000次,在Object#m2中花费的时间是0.125秒,而在Object#m1中花费的时间是0.020秒,多出了0.105秒,这样,
我们能定位出问题出在了Object#m2这里。
graph可输出为html格式,这里只是演示了纯文本版,html格式更容易交互,需要添加参数-f指定输出的路径和文件名。
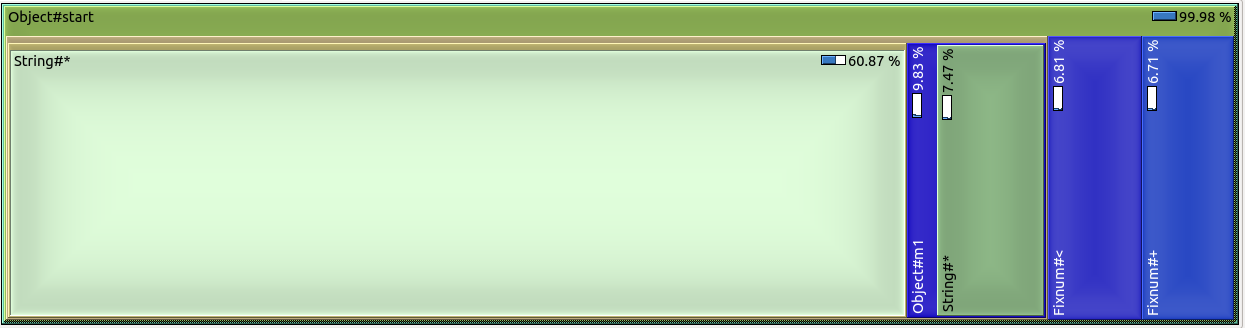
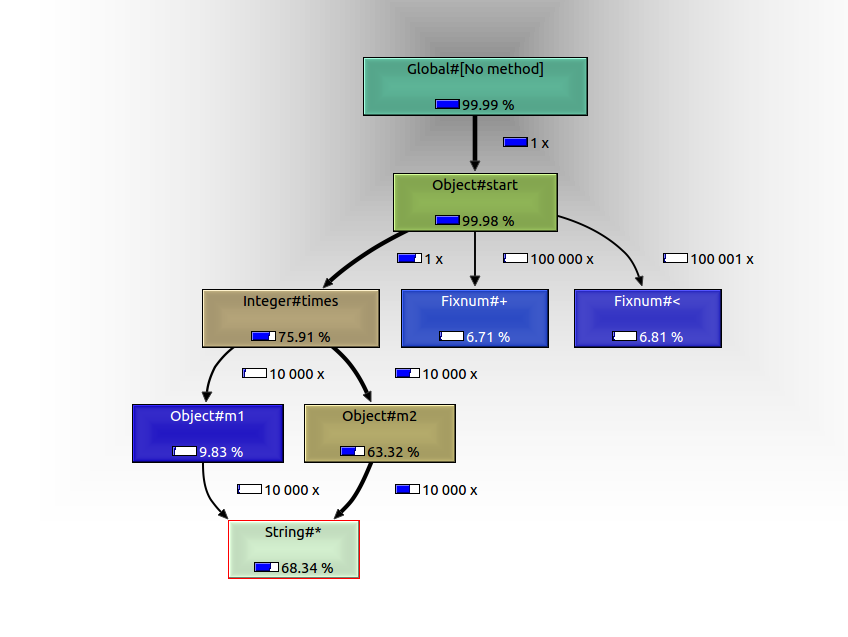
GraphViz dot - dot
ruby-prof -p dot test.rb -f dot.dot
有工具可以将dot文件转换为pdf查看,也有专门查看dot文件的工具,比如ubuntu上的XDot。
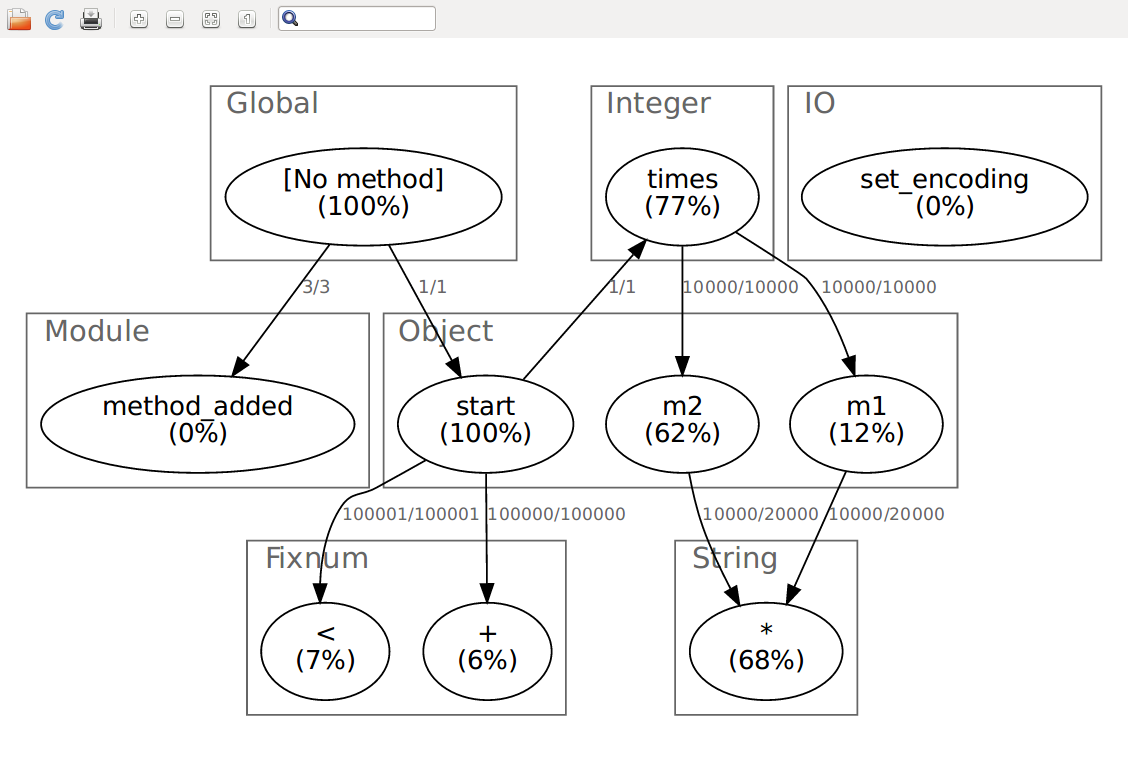
这张图也明确说明了问题出在了Object#m2这里。
可交互的调用关系 - call_stack
ruby-prof -p call_stack test.rb -f callstack.html
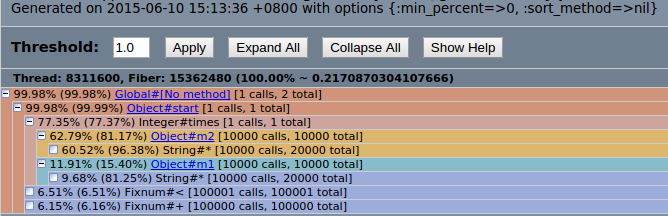
这里真是一图胜千言,一目了然,Object#m2中的String#*的10000次调用花费了60.52%的时间,不用多解释,快点自己尝试一下吧。
终极万能全视角 - call_tree
首先安装KCacheGrind,ubuntu下直接'sudo apt-get install kcachegrind'
ruby-prof -p call_tree test.rb -f call_tree.out
打开KCacheGrind,然后打开call_tree.out(文件类型选所有),这个神奇的工具能呈现给你所有真相。
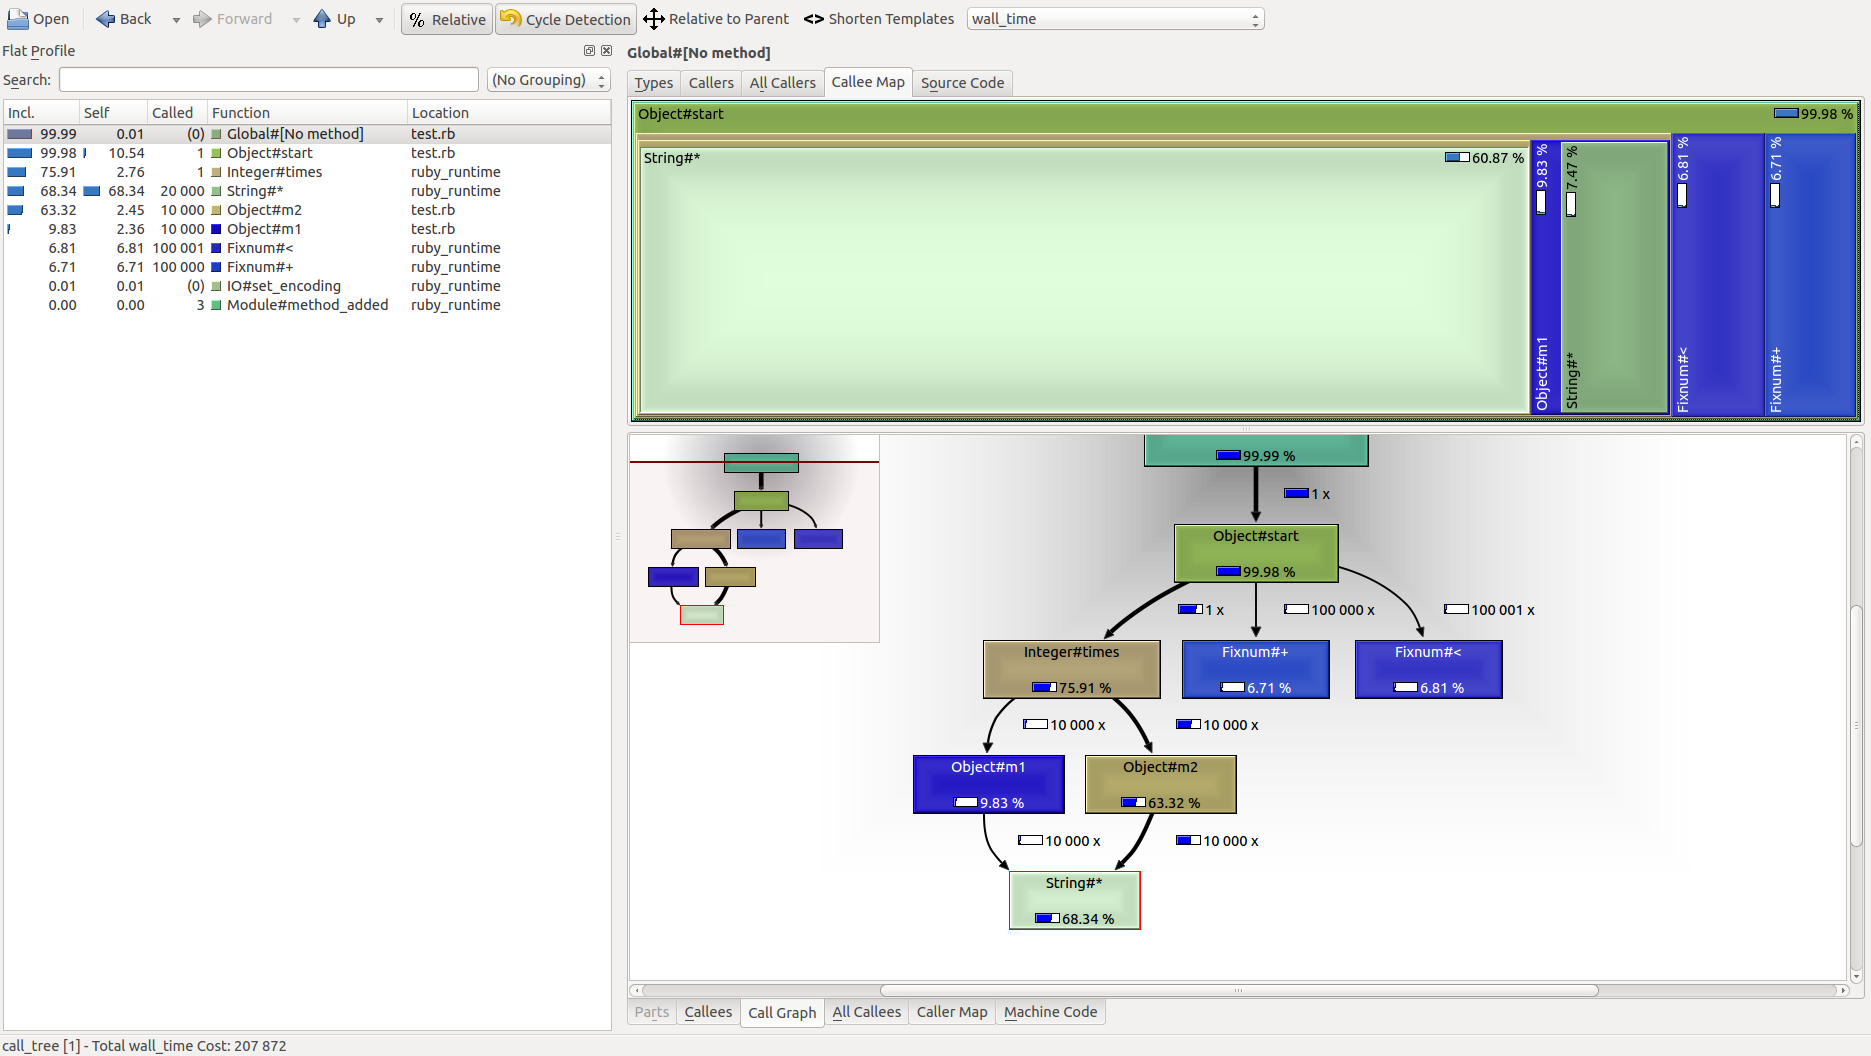
有了前面介绍的输出格式说明,看懂这个就很容易了,我们还是会介绍一下,不过是在另一篇,因为这篇有点太长了,下一篇 会详细介绍一下KCacheGrind的使用方法。